Life Insurance Claims Statistics – All the facts and figures

Which are the best life insurance companies for paying claims?
One question we are frequently asked at Insurance Watch is “Do life insurance companies really pay claims?”.
In order to answer this question conclusively, and highlight those companies who may be performing better than others, we have gathered together, all in one place, life insurance claims statistics and information from a variety of sources.
Life insurance companies issue policies for Death/Terminal Illness, TPD, Trauma and Income Protection insurance, so the statistics below are broken up into these different insurance types.
In addition, the information displayed below, unless otherwise stated, is the ASIC/APRA claims data for policies distributed by advisers/brokers (such as Insurance Watch) i.e. it does not relate to policies distributed directly through an insurer or through a superannuation fund.
What percentage of life insurance claims are paid overall?
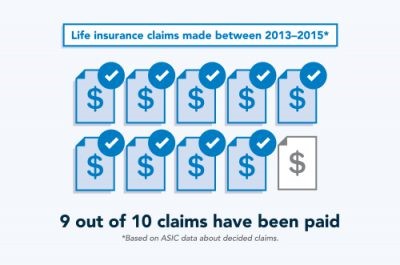
We know from studies done by ASIC and APRA that, for the life insurance industry as a whole, more than 90% of all claims are being paid. The overall percentage of claims paid was between 92% and 94% in the years 2016 to 2021.
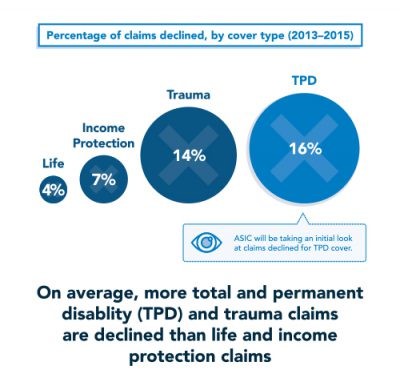
The percentage of claims paid varies depending on the type of insurance. The percentage of Life insurance and Income Protection claims paid is typically higher than for TPD and Trauma claims. This in part reflects the more complex requirements which need to be met for a successful TPD or Trauma claim.
Claims acceptance rates can also vary depending on the distribution channel. An ASIC report in 2018 highlighted that direct life insurance had lower claims payout ratios than fully underwritten policies taken out through advisers/brokers. The claims acceptance data for calendar year 2024 (2025 statistics will be available in April 2026) continues to show lower claims acceptance rates for policies sold directly to the public.
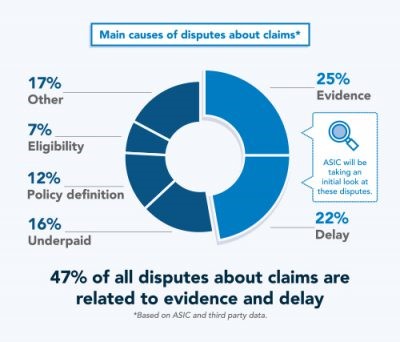
A 2016 report by ASIC into claims handling in the life insurance industry (summarised in the infographic below) examined some of the reasons why claims decisions have been disputed in the past and the areas they would be focussing on with insurers to deliver better outcomes in the future.
A later 2022 ASIC review of the way insurers handle income protection claims found that there was still room for improvement.
Life Insurance Industry Claims & Disputes – last 7 years
APRA/ASIC have been collecting detailed claims data over the last 7 years – for the period 2018 to 2024.
Over this time claims acceptance rates for Life and Income Protection policies have been relatively steady.
However the latest statistics for 2024 confirm that there has been a deterioration in claims acceptance rates for Trauma and TPD policies since 2022.
Over the last 7 years there has been an increase in claims disputes across all product categories.
APRA noted a sharp increase in income protection claims dispute rates from 2021 related to the repricing activities of insurers to address product sustainability issues.
In 2024 disputes for income protection claims have decreased and disputes for other product types have levelled out.
How have individual life insurance companies performed in paying claims?
In March 2019 ASIC and APRA released for the first time statistics on the payout rates of individual insurers.
The most recent data released on 15th April 2025 covers claims for the 12 month period ending 31 December 2024 (data for claims in 2025 will be available in mid April 2026).
For each life insurance company these statistics show:
- Average claims accepted rate, i.e. the percentage of claims an insurer accepted for payment out of all claims that were decided, and
- Average claim time in months that it took for an insurer to decide whether or not to accept a claim.
We present graphically below the 2024 claims statistics for each life insurance company for policies issued through financial advisers/brokers for different insurance types e.g. Life, TPD, Trauma and Income Protection. Where no result is shown for an individual insurer this is because APRA have reported that the number of claims was too small to provide a reliable result. Claims statistics for other sales channels can be viewed on MoneySmart.
To see how the claims acceptance rates for individual insurers have changed over the last 7 years go to Compare Life Insurance Companies.
To compare the policy benefits and premiums offered by these insurers use Compare Quotes Online.
Life Insurance Claims Statistics 2024
For life insurance claims, the industry average acceptance rate in 2024 was 96.9%.
In 2024 Resolution Life/AMP had the highest Life insurance claims acceptance rate of 98.8% and Westpac/BT/TLIS the lowest claims acceptance rate of 94.3%.
The average time for a life insurance claim to be accepted was 1.3 months in 2024.
Resolution Life/AMP were the fastest for paying life insurance claims in 2024 at 0.8 month on average, with the slowest being ClearView at 2.7 months.
TPD Insurance Claims Statistics 2024
For TPD insurance claims the industry average acceptance rate in 2024 was 83.8%.
In 2024 Acenda/MLC/Encompass had the highest TPD claims acceptance rate of 93.1% and ClearView had the lowest claims acceptance rate of 69.3%.
The average time for a TPD insurance claim to be accepted was 7.3 months in 2024.
The fastest insurer for paying TPD claims in 2024 was Acenda/MLC/Encompass at 6.2 months on average, with the slowest being ClearView at 10.0 months.
Trauma Insurance Claims Statistics 2024
For Trauma insurance claims, the industry average acceptance rate in 2024 was 85.4%.
In 2024 NobleOak/NEOS had the highest trauma claims acceptance rate of 96.0% and TAL had the lowest claims acceptance rate of 81.6%.
The average time for a Trauma insurance claim to be accepted in 2024 was 1.5 months.
Acenda/MLC/Encompass paid trauma claims the fastest on average in 2024 at 1.1 months with the slowest being Westpac/BT/TLIS at 1.8 months.
Income Protection Claims Statistics 2024
For Income Protection insurance claims, the industry average acceptance rate in 2024 was 95.0%.
In 2024 Resolution Life/AMP had the highest income protection claims acceptance rate of 97.8% and ClearView had the lowest claims acceptance rate of 91.0%.
The average time for an Income Protection insurance claim to be accepted was 1.6 months in 2024.
Westpac/BT/TLIS were the fastest payer of income protection claims on average in 2024 at 1.3 months with the slowest being Clearview at 2.3 months.
Under the FSC Life Insurance Code of Practice, insurers should make their initial decision within 2 months of a claim for income protection and within 6 months for other cover types.
Find out how to compare income protection policies from these insurance companies.
Which life insurers have the most claims disputes?
In 2023/24 the Australian Financial Complaints Authority (AFCA) handled 104,861 disputes related to financial services. Of these, they reported only 1449 complaints or 1.4% of disputes were related to life insurance including TPD, Trauma and income protection insurance.
ASIC and APRA have released claims dispute statistics for individual companies for the year ending 31 December 2024. These statistics include disputes lodged with an insurer, an external dispute resolution scheme like AFCA, or a Court or Tribunal. The reasons for these disputes include dissatisfaction with claims decisions, amount received or the claims process.
The absolute number of disputes need to be viewed relative to the number of lives insured by that insurer. Therefore the data from ASIC below shows for each insurer the number of disputes for every 100,000 people insured (data shown below is for policies taken out through financial advisers/brokers only).
On this adjusted basis, in 2024 Zurich had the highest number of claims disputes for Life and TPD policies and Resolution Life/AMP had the highest number for Trauma and Income Protection policies.
What is the claims experience of other industry players?
Over time Insurance Watch has helped many of its customers to make successful claims on their policies. In other parts of the website we provide examples of these Life Insurance, Trauma and Income Protection claims. In our experience very few claims are declined, although non disclosure can put clients at risk. As every claim is different in its circumstances, it is difficult to generalize these results across insurers.
A survey of advisers in 2016 tried to obtain an industry wide perspective of the relative claims performance of insurance companies. The survey results ranked insurers according to adviser perceptions of how the companies managed claims. However as the claims experience of each adviser may be limited, the results are likely to be subjective rather than based on factual data.
What is the experience of customers who have submitted claims?
Customer reviews have been left on our website by over 1,600 Life, TPD, Trauma and Income Protection policyholders. From these we can learn about the claims experiences of individuals – both good and bad. But again we can’t know the full circumstances behind each claim (e.g. were these superannuation, direct or retail policies, was there any non-disclosure involved etc) or how indicative these particular claims are of an insurer’s overall performance.
What we do know is that good news stories often don’t often receive much publicity. So we have collected claims videos from various insurers telling the moving stories of clients who have needed to make a claim and how this has made a difference to their lives and the lives of their families.
You can watch videos of their real life stories below:
Life Insurance and TPD Claims Stories
Trauma / Critical Illness Claims Stories
Income Protection Claims Stories
What do the detailed life insurance claims statistics show?
The overall claims statistics show that claims do get paid and in very large numbers. The Financial Services Council released aggregate figures across the whole Australian life insurance market showing that in 2019 over 100,000 claims were paid amounting to over $12 Billion. This should give confidence to buyers of insurance policies that help will be there when they need it the most.
Below we have included the detailed claims statistics from 2022-2024 provided by the three largest life insurance companies in Australia – TAL, AIA and Zurich (including OnePath). These provide a breakdown of claims paid.
The absolute dollar value of claims paid must be viewed in the context of the size of each insurer and their premiums in force. In some cases the insurer has only provided claim statistics for the retail sector of the market, which does not include claims from group/super or direct policies.
Equally the mix of claims for each insurer will be influenced by the composition of their customers. For example, each insurer has a different mix of Life/TPD/Trauma/Income Protection insurance policies, group/super versus individual/retail policies, policyholder ages and occupations.
Overall, this evidence supports the conclusion that there are billions of dollars in claims being paid by life insurance companies each year to support families during their time of need.
Compare the premiums and benefits offered by these companies at Compare Quotes Online


Other useful information:
- Find out how to make a claim by watching the video “Understanding the Claims Process“
- Compare quotes and benefits for the policies offered by the above insurance companies at Compare Quotes Online Now
- Find out who owns the above insurance companies, their size and their background at Compare Insurance Companies
- Obtain advice on your personal situation from one of our qualified advisers, including insurance strategies and policies to suit your needs, by going to Get Advice